Article Text

Abstract
Objectives Uncertainties exist about when and how best to adjust performance measures for case mix. Our aims are to quantify the impact of case-mix adjustment on practice-level scores in a national survey of patient experience, to identify why and when it may be useful to adjust for case mix, and to discuss unresolved policy issues regarding the use of case-mix adjustment in performance measurement in health care.
Design/setting Secondary analysis of the 2009 English General Practice Patient Survey. Responses from 2 163 456 patients registered with 8267 primary care practices. Linear mixed effects models were used with practice included as a random effect and five case-mix variables (gender, age, race/ethnicity, deprivation, and self-reported health) as fixed effects.
Main outcome measures Primary outcome was the impact of case-mix adjustment on practice-level means (adjusted minus unadjusted) and changes in practice percentile ranks for questions measuring patient experience in three domains of primary care: access; interpersonal care; anticipatory care planning, and overall satisfaction with primary care services.
Results Depending on the survey measure selected, case-mix adjustment changed the rank of between 0.4% and 29.8% of practices by more than 10 percentile points. Adjusting for case-mix resulted in large increases in score for a small number of practices and small decreases in score for a larger number of practices. Practices with younger patients, more ethnic minority patients and patients living in more socio-economically deprived areas were more likely to gain from case-mix adjustment. Age and race/ethnicity were the most influential adjustors.
Conclusions While its effect is modest for most practices, case-mix adjustment corrects significant underestimation of scores for a small proportion of practices serving vulnerable patients and may reduce the risk that providers would ‘cream-skim’ by not enrolling patients from vulnerable socio-demographic groups.
- General practice
- family medicine
- quality of care
- healthcare quality improvement
- primary care
- health services research
- quality measurement
- patient satisfaction
This is an open-access article distributed under the terms of the Creative Commons Attribution Non-commercial License, which permits use, distribution, and reproduction in any medium, provided the original work is properly cited, the use is non commercial and is otherwise in compliance with the license. See: http://creativecommons.org/licenses/by-nc/2.0/ and http://creativecommons.org/licenses/by-nc/2.0/legalcode.
Statistics from Altmetric.com
- General practice
- family medicine
- quality of care
- healthcare quality improvement
- primary care
- health services research
- quality measurement
- patient satisfaction
Background
Performance measurement is central to improving the quality of medical care, facilitating patient choice, and incentivising providers to improve care. Case-mix adjustment seeks to control for differences in patient characteristics not under the control of providers to facilitate fair comparison among healthcare providers by estimating the scores providers would have received if serving a common population.1 Such adjustment can be applied to measures of clinical process,2 ,3 patient experience,1 ,4–7 and medical outcomes.8–11
The use of case-mix adjustment for mortality is relatively well established12–15—although uncertainty exists about optimal methods10 ,16—while the application of case-mix adjustment for clinical process and patient experience measures varies within the UK and internationally. For example, in the USA the same Consumer Assessment of Healthcare Providers and Systems (CAHPS) data are presented by the Centers for Medicare and Medicaid Services (CMS) adjusted,17 and by the National Center for Quality Improvement (NCQA) unadjusted.18
Variability in the use of case-mix adjustment may reflect both ideological differences and practical uncertainties about when and how to adjust for patient case mix. Some have suggested that performance indicators should not be case-mix adjusted, citing concerns that such an approach disregards the imperative to provide the best possible care to all patients. Yet organisations with high proportions of patients who are difficult to treat or generally more likely to report negative experiences could be disadvantaged by performance incentives based on unadjusted performance measures. Such disadvantage may encompass loss of income (eg, under pay-for-performance), but may also damage staff morale, and undermine the ability to recruit and retain high-calibre healthcare professionals and/or attract and retain patients.
Further empirical research is needed to assist and inform such decision making, given the inconsistent use and ongoing debate about the benefits of case-mix adjustment.5 ,19 ,20 In England, detailed measurement of clinical performance is used as part of a pay-for-performance scheme in primary care,21 and between 2008 and 2011, the scheme included financial incentives based on data from a national survey of patient experience.22 ,23 Using data from this survey, we quantify the impact of case-mix adjustment on the mean scores and rankings of primary care practices. We ascertain who would be the winners and losers under case-mix adjustment, by how much, and why. Our aim is to demonstrate the difference which case-mix adjustment might make in performance assessment, to identify why and when it may be useful, and to discuss important policy issues in case-mix adjustment.
Methods
Anonymised data were analysed from all 2 163 456 people registered with 8267 primary care practices in England who responded to the 2009 General Practice Patient Survey, a national survey of patient experience with primary care (response rate 38%). Women, middle-aged patients, and those in affluent areas were more likely to respond to the survey, consistent with response patterns reported for other patient experience surveys.24 Details of the survey and method of administration have been published elsewhere.23 ,25
Patient experience measures
We measured patient experience using a single item to assess overall satisfaction with primary care services, and 12 items assessing patient experience in three domains of primary care: access, interpersonal care, and anticipatory care planning. Response options included both dichotomous categories (yes/no) and three-point, four-point and five-point Likert scales. The questionnaire can be viewed at http://www.gp-patient.co.uk/questionnaires/ and the content of each question is summarised in the appendix, table A1. All measures were linearly re-scaled to a 0–100 range (most favourable response =100) to facilitate comparisons across questions. Composite measures were computed separately for doctor communication and nurse communication using the mean of non-missing items from all respondents answering four or more of the seven items which made up each composite.
Case mix
Five patient characteristics were investigated as potential case-mix adjustors: age (eight ordinal categories from 18–24 to 85+; 55–64 (reference group)), male gender, Office of National Statistics ethnicity (white (reference group); mixed; South Asian; black; Chinese; other), self-reported health (excellent (reference group), very good, good, fair, poor), and socio-economic status of residential address (by quintile; using the highest level of deprivation as the reference group). The last of these was the only variable measured at aggregate level and was derived by linking patient postal codes to the 2007 Lower Super Output Area Index of Multiple Deprivation26 (higher quintiles represent greater socio-economic deprivation).
Analyses
We used linear mixed effects regression models with practice as a random effect and case-mix adjustors as fixed effects, to predict each of 13 measures of patient experience with primary care (multiple items for access, interpersonal care, anticipatory care planning, and a single item measuring overall satisfaction with primary care services). The use of practice random effects ensures that adjustments are limited to differences observed within practices and are not biased by the confounding of overall practice performance with between-practice differences in patient characteristics.
Metrics
Overall impact of case-mix adjustment
To quantify the impact of case-mix adjustment we used two primary metrics:
(1) To convey the absolute change resulting from case-mix adjustment we calculated differences on the 0–100 scale between case-mix adjusted and unadjusted practice-level mean scores. We described absolute changes in practice means resulting from adjustment by showing the distribution of the changes in means, and by calculating the proportion of variance in adjusted practice-level means attributable to case-mix adjustment, p=(1−r2) where r is the Pearson's correlation coefficient between adjusted and unadjusted practice-level means.
(2) To convey relative change resulting from case-mix adjustment we calculated changes in practice rankings. We described the frequency of large impacts by counting the proportion of practices that change rank by 10 or more and by 20 or more percentile points after case-mix adjustment was applied. We also used Kendall's Tau (τ) to calculate the discordance of ranks under case-mix adjustment, d, where d (d=(1−τ)/2), represents the probability that the higher rank of a given practice relative to another practice becomes the lower rank relative to the same practice after case-mix adjustment (or vice versa).
How the effect of case-mix adjustment varies in relation to practice characteristics
To identify the type of practices likely to gain or lose most as a result of case-mix adjustment, we first arranged all practices in descending order according to the impact of case-mix adjustment on practice-level means (adjusted–unadjusted) for each of the two questions, 7 and 10, which related to the ability of patients to get appointments with their general practitioner and which were associated with pay-for-performance between 2008 and 2011. We then calculated descriptive characteristics for respondents in practices in the highest decile (the biggest ‘winners’ from case mix adjustment); the lowest decile (the biggest ‘losers’); and middle 10% of practices (‘typical impacts’).
Relative importance of individual case-mix adjustors
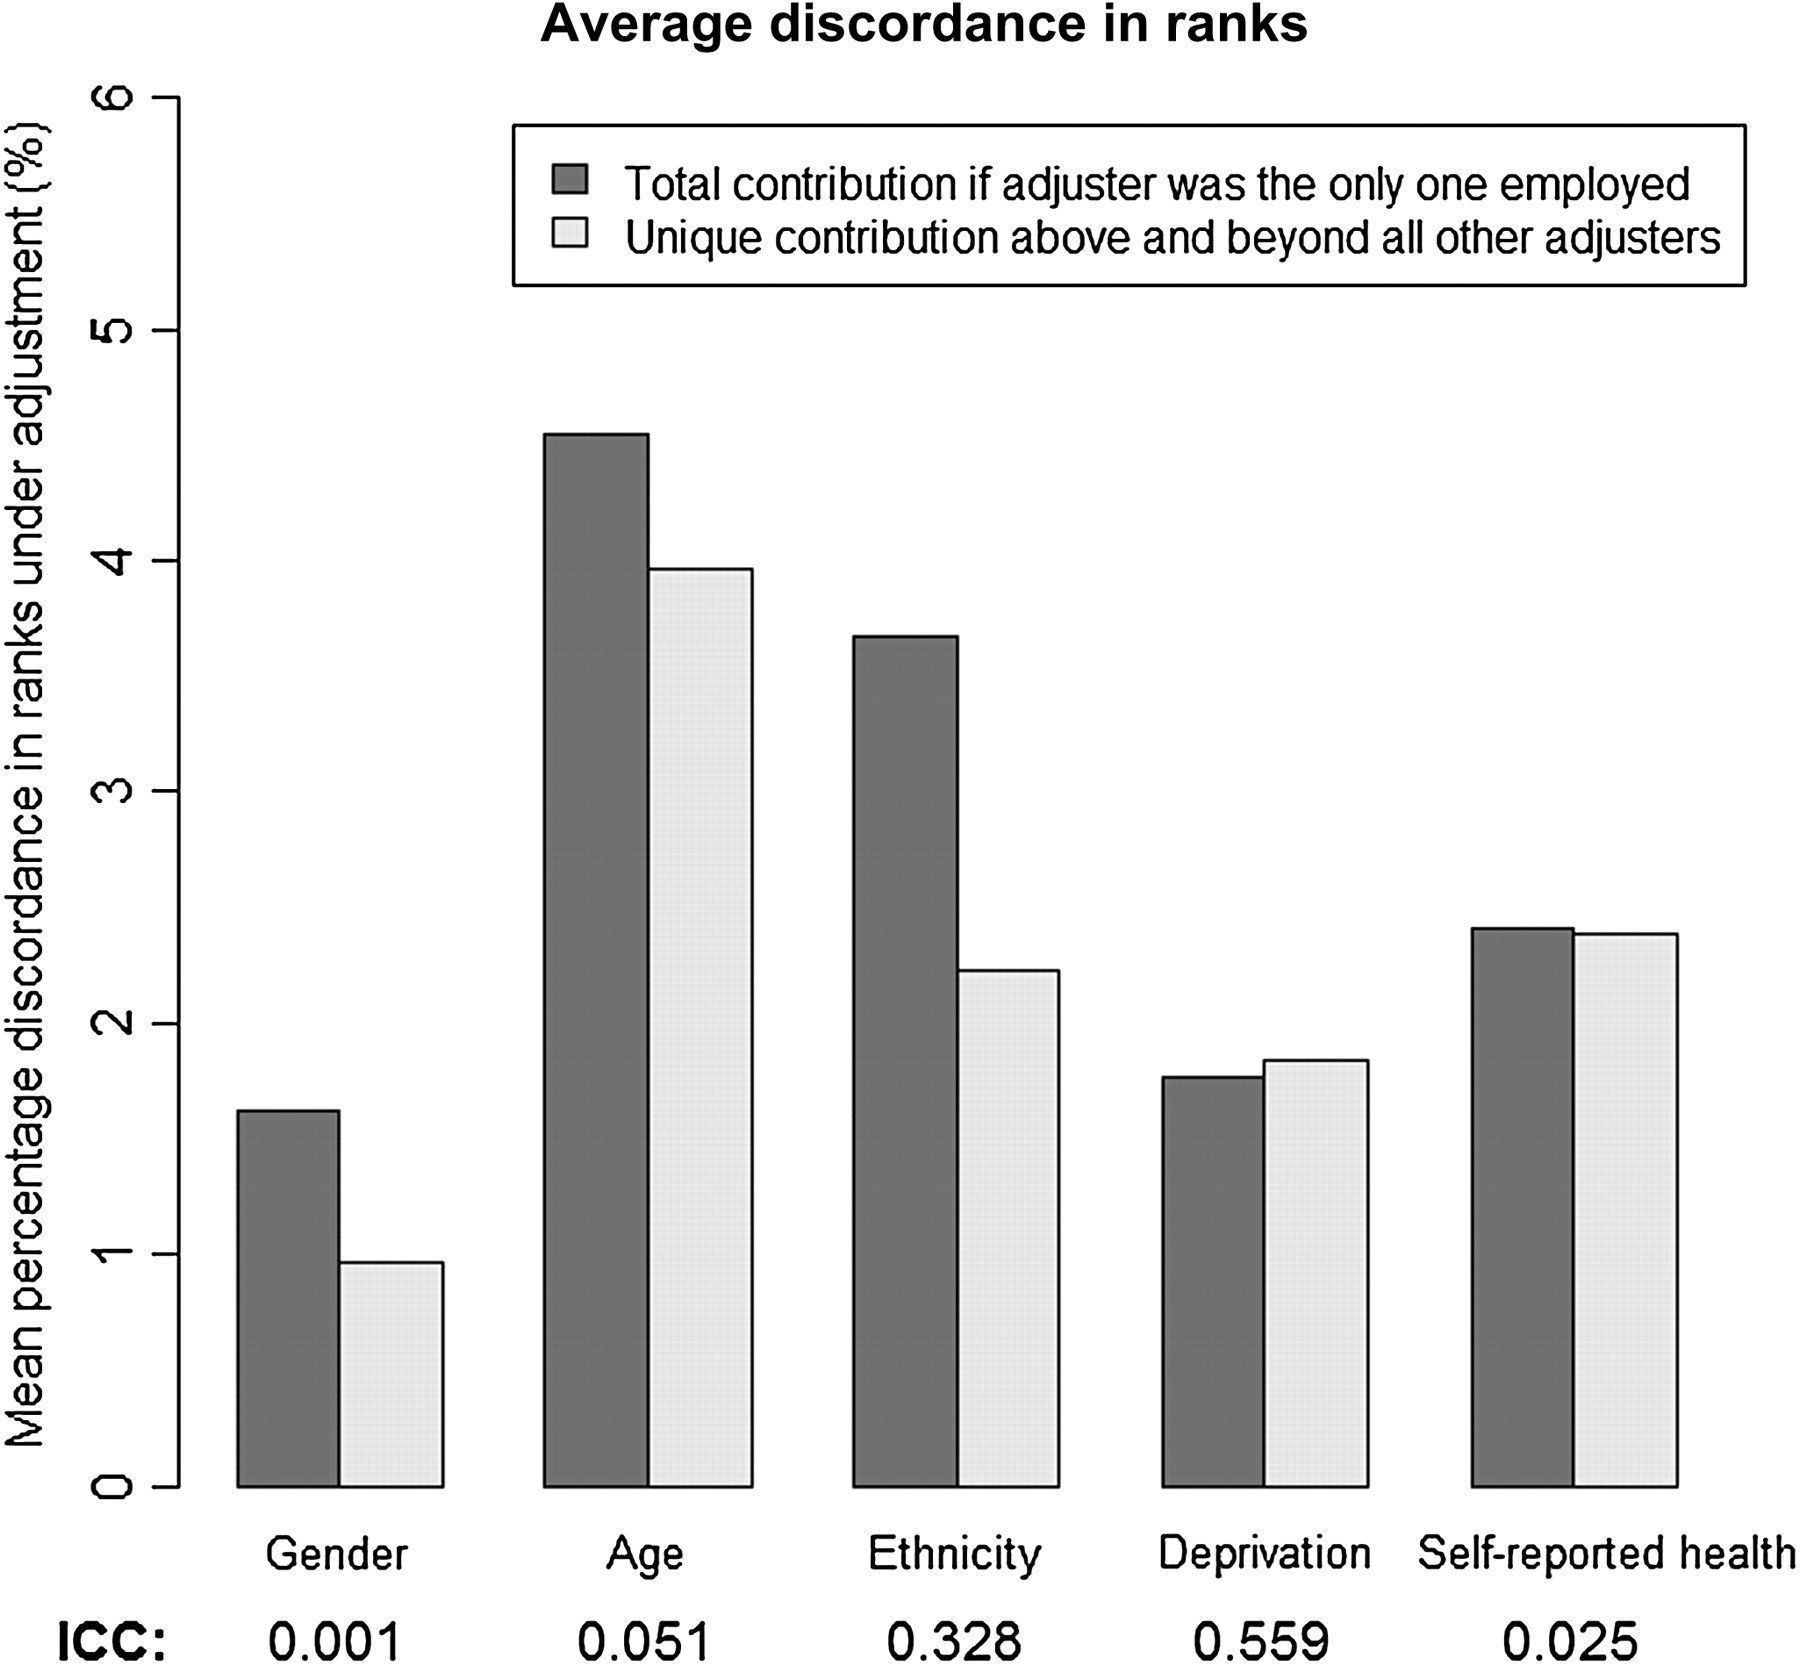
To measure the contribution of individual case-mix adjustment variables we used discordance in ranks to describe the total contribution of a single case-mix adjustor if it were the only adjustor employed (assessed by comparing ranks from models adjusting only for the case-mix adjustor being examined to unadjusted ranks), and the unique contribution of a single case-mix adjustor above and beyond all others (assessed by comparing ranks from fully adjusted models to ranks from models adjusting for all but the one adjustor being examined).
The impact of any case-mix adjustor is a function of two factors: how strongly predictive the adjustor is of individual patient scores within practices; and how much the adjustor varies between practices.4 To assess the predictive strength of each adjustor we examined standardised coefficients showing the relationship between individual case-mix variables and each of the 13 measures of patient experience in our primary regression models. We then calculated practice-level intraclass correlation coefficients (ICCs) for each adjustor to measure its heterogeneity between practices.
SAS V.9.2 was used to perform all linear mixed effects modelling. SPSS/PASW for Windows (V.18.0.3) and R V.2.12.0 were used for all other analyses.
Results
Demographic characteristics and the self-reported health of the 2 163 456 respondents to the 2009 General Practice Patient Survey appear in table 1. Fifty-eight per cent of respondents were women; 30% were aged over 65; and 14% were non-white. Practice-level and patient-level mean scores for questions from the General Practice Patient Survey appear in appendix table A1.
Demographic characteristics and self-reported health of respondents to the 2009 General Practice Patient Survey (England)
Overall impact of case-mix adjustment
Table 2 shows the impact of case-mix adjustment on practice-level mean scores and practice ranks. Case-mix adjustment accounted for 1–12% of the variance in practice-level mean scores (see column 1), and changed the relative ranks of between 2% and 11% of practices in pairwise comparisons (see column 2). The impact of case-mix adjustment on practice-level means varied by patient experience domain, with a larger impact on anticipatory care planning items (questions 28 and 29) and a smaller impact for questions relating to access (getting through on the telephone; getting an urgent appointment; booking ahead; and evaluation of waiting time).
Impact of adjustment for all case-mix variables on practice level mean scores, and practice rankings
Adjusting for patient characteristics had modest impacts for most practices, but between 0.4% and 29.8% of practices changed rank by 10 percentile points or more (table 2, columns 3 and 4), and up to 6% of practices changed rank by 20 percentile points or more (table 2, columns 5 and 6). As can be seen in table 2, gains of 10 or more percentile points of rank were somewhat more common than losses of 10 or more percentile points.
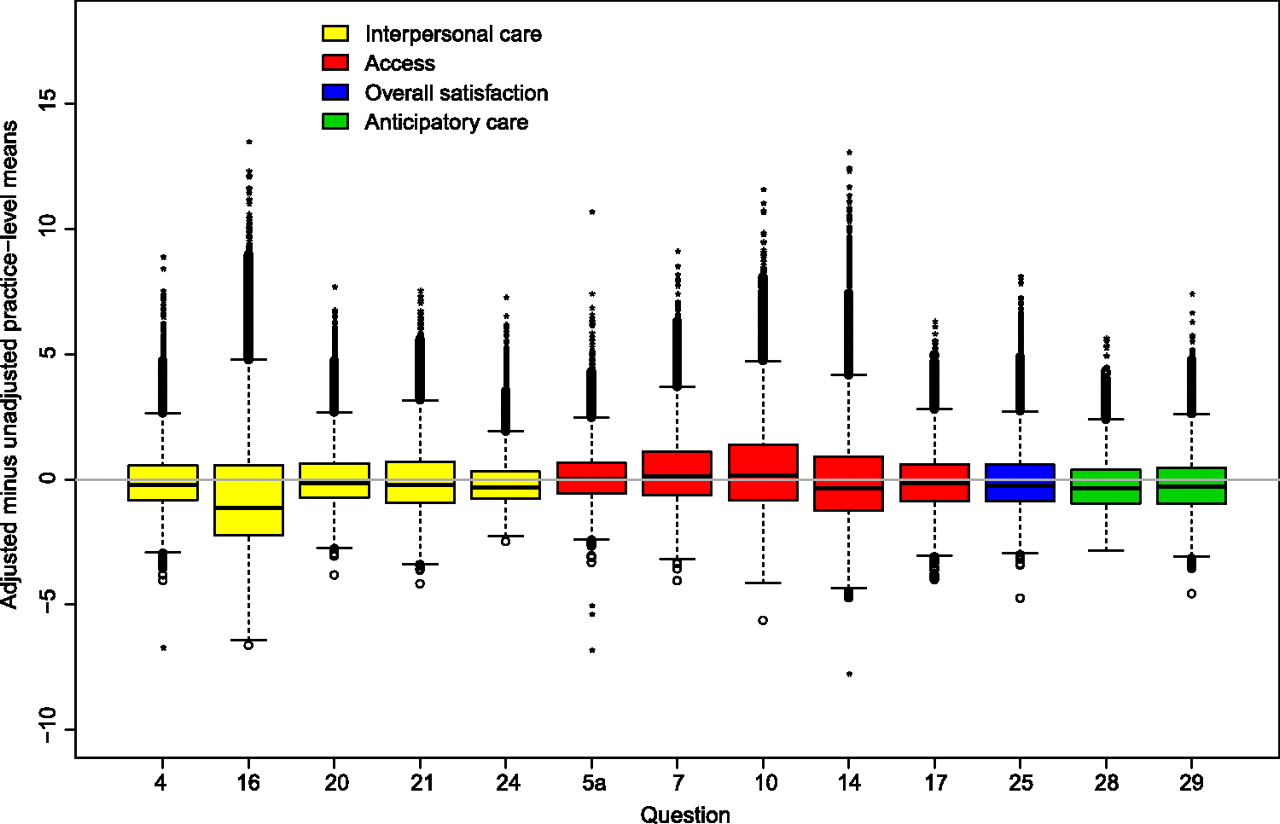
Figure 1 shows the magnitude and direction of differences in practice-level mean scores on 13 patient experience questions after case-mix adjustment is applied. The proportion of practices that are outliers (more than 1.5 times the IQR outside the actual IQR) ranges from 2.5% to 6.9% across questions. As can be seen in figure 1 these differences in practice-level means are generally 5–10 points on the 0–100 scale (corresponding to 20–50 percentile points of change in rank, see appendix, figure A1), with the larger outlier adjustments almost entirely positive, that is, representing practices whose mean scores increased as a result of case-mix adjustment.

Boxplot showing impact of case-mix adjustment on practice level means (adjusted–unadjusted means). Whiskers show 1.5 IQR beyond the actual IQR; cases outside the IQR by at least 3 IQR are shown as*.
How the effect of case-mix adjustment varies in relation to practice characteristics
Practices showing the largest gain in scores from case-mix adjustment (‘winners’ in the top decile), middle decile practices (‘typical’, very small adjustments), and bottom decile practices (‘losers’ from adjustment), had very different average patient populations, especially with respect to deprivation and ethnicity (see table 3). Among the 10% of practices gaining most from case-mix adjustment, on average, 82% of patients lived in the most deprived areas (lowest two quintiles), 45% of patients were white and 31% South Asian. In comparison, the 10% of practices who lost most from case-mix adjustment had a patient population that averaged 97% white, and only 10% of their patients lived in the most deprived areas. Practices gaining most from case-mix adjustment were on average smaller and treated patients who tended to be younger and in worse health compared with other practices.
Characteristics of practices in the top 10% (gain most from case-mix adjustment), mid 10%, and bottom 10% when all practices are arranged by magnitude of change in practice-level mean scores after case-mix adjustment
Relative importance of individual adjustors
Figure 2 summarises the relative importance of each of the five case-mix adjustor variables, averaged across all items. Age is the most influential adjustor (accounting for about 4% discordance by itself) and gender the least (∼1% discordance). Ethnicity is nearly as important as age when taken alone, but its unique contribution is similar to those for deprivation and self-reported health (∼2%). The ICCs show that deprivation and ethnicity vary greatly across practices and gender almost not at all. Standardised regression coefficients (appendix table A2) show relatively strong relationships of age and self-reported health with measures of patient experience within practices, but relatively small coefficients for gender and deprivation.
Average discordance of ranks across all items using data on Kendall's Tau and intraclass correlation coefficients (ICCs) to identify the variables that have the biggest impact when case-mix adjustment is applied.
Discussion
In a study of 2 163 456 respondents from 8267 English primary care practices we show that case-mix adjustment of practice-level scores results in relatively few large adjustments (which were mainly positive), and many small adjustments (which were more often negative). However, the largest effects were on a distinct subset of practices whose patients were more likely than average to be from South Asian or other ethnic minorities, young, in poorer health, and living in deprived areas.
Although only a small number of practices would benefit significantly from case-mix adjustment, we propose that such adjustment should be applied because it meaningfully improves performance measurement for practices with less typical and often under-privileged patient populations, This would discourage practices from ‘cream-skimming’ by avoiding enrolling patients who could be seen as ‘hard to treat’, and increase perceptions of fairness and engagement in quality improvement activities.
In a study of 27 practices in the UK (patient race/ethnicity 97% white), Salisbury and colleagues conclude that ‘adjusting for patients' characteristics makes very little difference to practices' scores or to the performance of individual practices relative to other practices’.6 Our study, with a larger sample of practices and including a broader mix of patient characteristics (practice N=8267; patient race/ethnicity 14% non-white), suggests that case-mix adjustment has a non-trivial impact on the assessment of performance for practices serving less typical, and often disadvantaged, patient populations. Unfairly disadvantaging such practices in performance measurement could have negative implications for retention and recruitment of healthcare staff working in them, and for attracting and retaining patients.
Our study builds on what is known from previous research by addressing some of the limitations of previous studies, which include smaller sample sizes, non-random selection of practices, and a low proportion of non-white respondents.6 A particular strength of our study is the large sample size, enabling us to investigate the impact of case-mix adjustment on practices serving less typical patient populations. Because of the population basis of the sampling, our study is also not subject to problems such as regional variation in coding which may cause problems when using diagnostic coding for case-mix adjustment.27
Although parsimonious models are often desirable, one limitation of this study is the relatively small number (five) of case-mix adjustors included. While age, gender, ethnicity, self-reported health, and socio-economic deprivation are considered pertinent for case-mix adjustment in both the UK and the USA there are additional patient characteristics, such as language spoken at home, that have been used as case-mix adjustors in prior research5 but were not measured in this study. Another limitation is the modest response rate to the survey (38%). However in our previous analysis of two questions associated with payment to practices we found minimal evidence of non-response bias,23 and this is consistent with a meta-analysis of survey methodology literature showing that response rates are only weakly associated with non-response bias among studies employing methodology similar to ours.28 There are limits to the generalisability of our findings. The impact of individual case-mix adjustors may vary between countries due to differences in, for example, the constituent racial/ethnic groups in each nation, and we were not able in our study to explore variation across nations or healthcare settings.
Implications for health policy and practice
Because case-mix adjustment reduces bias4 ,5 and improves the validity of performance measurement (especially for some practices) it is integral to supporting patient choice and facilitating quality improvement in hospitals and in primary care.5 In addition, by improving perceived fairness, or face validity,29 case-mix adjustment helps to maintain the credibility of pay-for-performance schemes, and focuses conversations on how to improve patient experiences4 by avoiding arguments from providers that ‘my population is special’.29 However, care must still be taken to communicate that negative adjustments are not ‘penalties’, and we recognise, like others,2 ,30 that there is a risk that case-mix adjustment could remove incentives for providers to address disparities in care and institutionalise substandard care by ‘masking’ poor care provided to some patient subgroups. In order to make visible any disparities in the provision of care by socio-economic status or race/ethnicity and to minimise the risk of institutionalising substandard care, it is important that case-mix adjustment is used in conjunction with strategies that collect data to monitor healthcare disparities and report quality measures stratified by, for example, socio-economic position and race/ethnicity.30
Deciding when and how to adjust performance scores for case mix
Case-mix adjustment is most useful when patient characteristics vary substantially between providers, and where these patient characteristics are strongly related to performance measures.5 Combined with previous US findings,5 ,7 our data suggest that age and health status are broadly important adjustors across nations and healthcare settings. Our research also suggests that adjustment for race/ethnicity may be important to ensure equitable comparison, and, when results are linked to financial incentives, equitable distribution of resources. Socio-economic status/deprivation was less important in these data than is often the case in the USA; these differences may reflect differences in healthcare systems or in the measurement of socio-economic status.
Conclusions
Case-mix adjustment has been inconsistently applied to performance measures in healthcare both in the UK and internationally. Our results show that the impact of case-mix adjustment on practice-level performance scores is modest for most practices but may meaningfully improve the measurement of performance for practices with less typical patient populations, discouraging practices from ‘cream-skimming’ by avoiding enrolling patients who could be seen as ‘hard to treat’. Without adjustment for patient mix, reports of organisational performance may disadvantage those practices serving less typical, often disadvantaged, patient populations.
References
Supplementary materials
Supplementary Data
This web only file has been produced by the BMJ Publishing Group from an electronic file supplied by the author(s) and has not been edited for content.
Files in this Data Supplement:
- Data supplement 1 - Online Appendix 1
Footnotes
Funding The study was funded by a grant from the UK Department of Health. The views expressed are those of the authors and not of the Department of Health.
Competing interests The authors have no conflicts of interest as defined by the International Committee of Medical Journal Editors. MR and JC act as academic advisors to Ipsos MORI for the development of the General Practice Patient Survey and have received remuneration for this.
Provenance and peer review Not commissioned; externally peer reviewed.
Data sharing statement Individual level data were provided to us by Ipsos MORI with a covering confidentiality agreement with the Department of Health. Under this agreement we are not at liberty to share the dataset with third parties.